Solar Panel Monitoring System
7/13/13 Panel Monitoring - Original Software
Once my system was producing power I was able to activate my monitoring software using my local computer network.
The output directly from the data monitor impressed me. It provides a fairly high resolution bar chart of the power output for a day, week, or month, with a reading every 5 minutes. It also displays the current power output in watts and the lifetime energy production in Wh. There are also a couple of system status indicators and several housekeeping options including basic site information, grid settings, file upgrade and login management, and system logs. It will display a module layout showing the relative output by the brightness of the module on the display, but there is no readout of watts for each panel like all their competitors provide. To get this information, you go to the module list. Here they display a list of the micro-inverter serial numbers along with the firmware level, status, volts, watts, and lifetime energy. These are sorted by the serial numbers, not the position on the roof. To get where these modules are on the roof you have to match the serial numbers to the locations in the layout view.
OK, this is just the unit mounted on my wall. The portal should expand this output and provide all kinds of useful readings, right? Wrong! Once I was given the portal address and accessed it, I found it was just a reduced version of my local output. What I had hoped the portal would do is to expand on the basic data provided it and present it in a more user friendly fashion. What it does not do is provide any direct way of reading the total energy produced for the last day, week, or month. To get these you need to read the lifetime energy before and after the time you are interested in and do the math. As I already mentioned, it also does not list the watts or kWh readings on the layout.
Sorry to be negative but there is a note of encouragement! I just read a press release from Solar Bridge that they have just released version 4.0 of their power monitor firmware. This is supposed to be a much improved version and I hope it will address my concerns. I also hope I will be receiving it shortly.

The primary display of the
software is this bar chart. By default it shows the last 24
hours, but you may select Day, Week, or Month.
You may also zoom in on any part of any of these displays by dragging the markers at the bottom. On a clear day, the shape of the pattern
would be a nice bell shaped curve, but with the Monsoon cloudiness we have been having, it is very irregular. The red line is the
lifetime total energy produced. You can read exact values of these figures by hovering the mouse over the data point, and a
box appears with the time and date, the exact number of current watts, and the lifetime Wh.
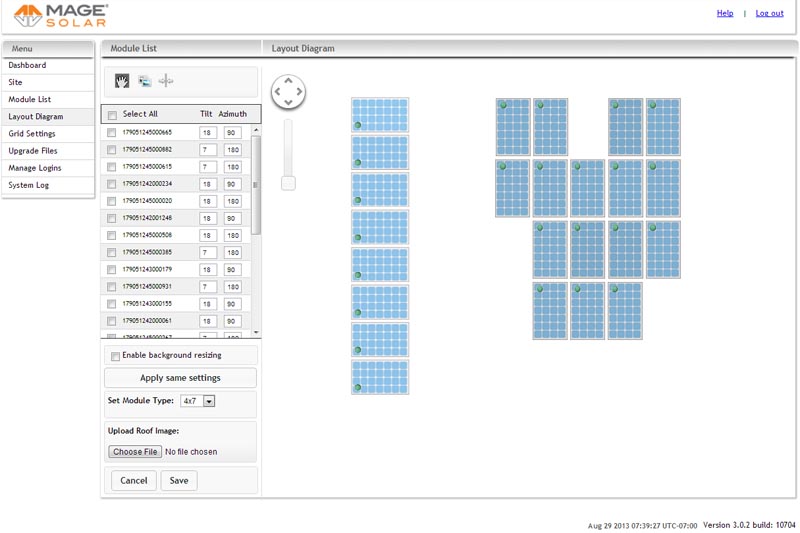
The rest of the panels face south, with the top 4 on an 18 degree slope and the rest at 7 degrees. The east facing panels have
a higher output in the morning. You can see that they are brighter than the south facing panels when this was captured. A wattage
readout on each panel would really be nice.
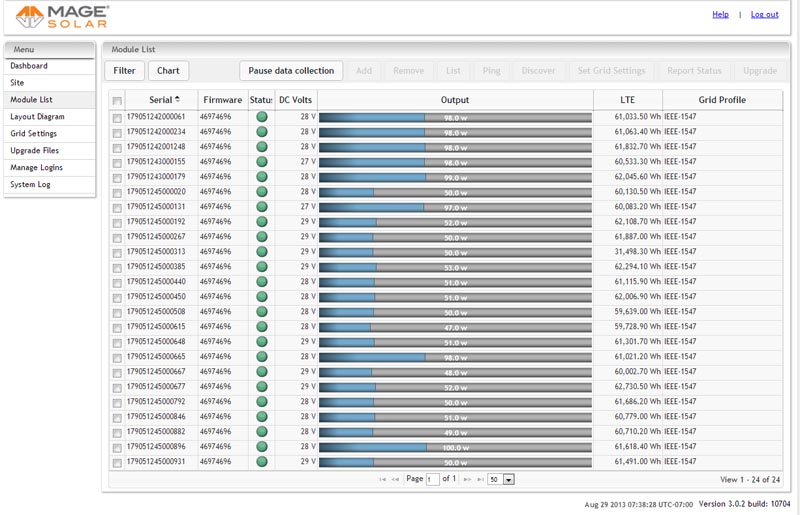
To really see what each panel is doing, you go to the Module List. It shows all the relevant data for each module. You can also
select a panel and click CHART. It will then give a display similar to the main display, only just for this module. On this display,
captured at about 7:40 AM it is easy to see the 8 east facing modules.
Addition of 8/25/13
The New Monitoring Software is Here!
Last night I went to my portal and it came up with the new software (version 4.0)! I am not at all disappointed with it! I was not sure how they would implement the new version. They could have loaded it into both my data monitor and on the portal, or just the portal. They did the latter. If I open my local version it is still what I have always had, Version 3.02. If I open the on-line portal, I get the new Version 4.00.
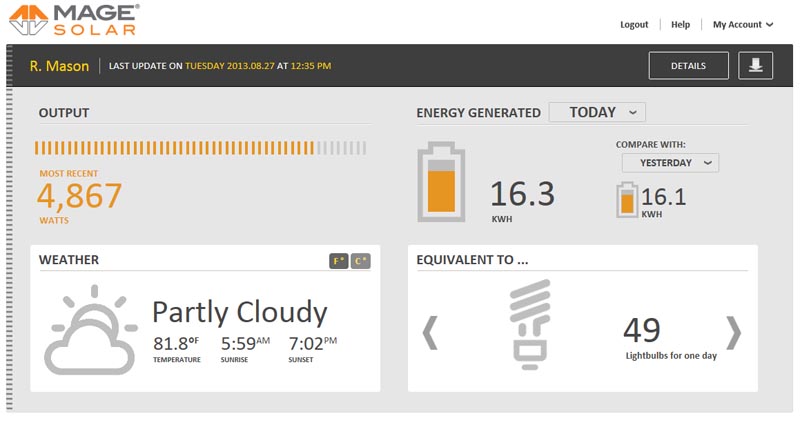
This is the main screen that initially comes up. As you can see it shows current power output both numerically and with a bar chart
which lets you see the approximate percentage of maximum output. It also shows how much energy has been produced so far
today and all of yesterday. You can select to show energy this week, this month, or lifetime and compare it with previous days,
weeks, or months. It also shows the current weather and a number of equivalent amounts of energy, such as light bulbs for a day,
gallons of gas, barrels of oil, and several others. So far, since I started generating solar, I have generated the equivalent of 111 gallons
of gas, and could have lit 4188 CFL light bulbs for 24 hours.
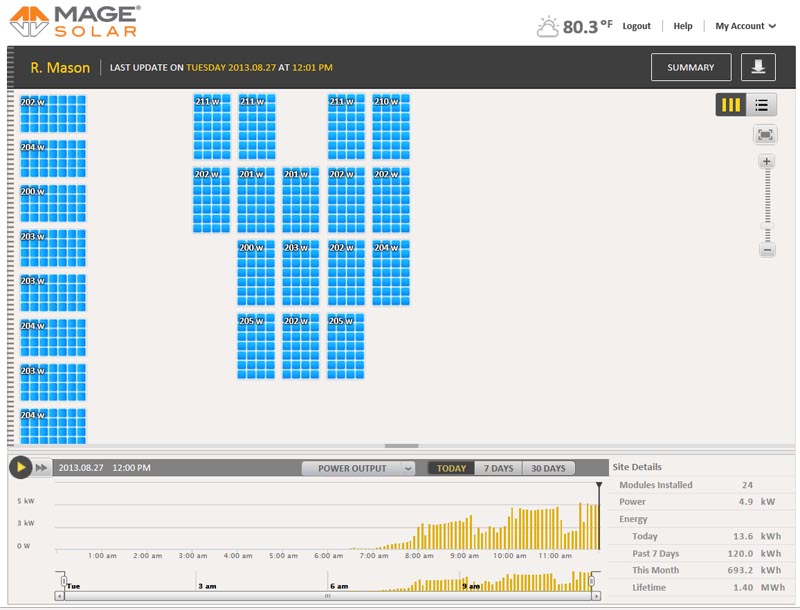
The details screen combines the previous panel layout and bar chart screens. Notice that the panels now list the wattage output! Hooray!
The numbers are much more readable on my main screen than they are in these clipped images. The bar chart at the bottom is very similar
to the the original bar chart. You can select day, week, or month, but now, in addition to monitoring power, you can also read the energy
output. In the lower right corner of the display, there is a summary of performance showing current power output and energy produced for
various periods. By default the bar chart shows total output of the panels, but by clicking on a single panel, it will show the details for that
panel only. You can also click on the play button at the left and the cursor will slowly cross the field and the panel layouts will show the output
in both numbers and brightness of the panels as the time progresses - a time-lapse review. You can select one of two speeds for this scan.
The biggest difference with the bar chart on the new version is that the time always starts at midnight and continues to the current time. The
old version always showed the last 24 hours. This gives the new display an expanded display - more so in the morning, less in the afternoon.
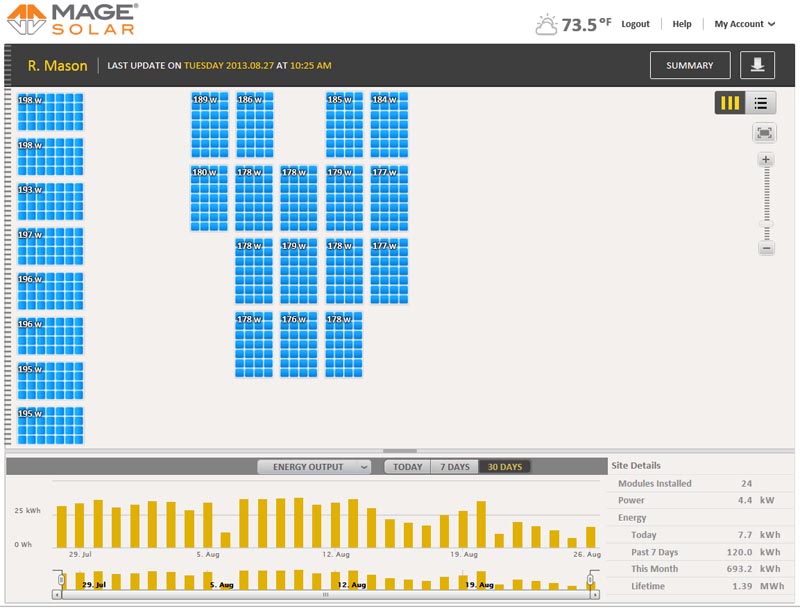
Here I have selected to show the energy output for the last 30 days. It shows the production in kWh for each day. As with all
the other bar charts you can see the exact values by putting the mouse pointer on a bar. A small box pops up with a time stamp
and the exact values showing. Again you can look at these for the total array or a single panel.
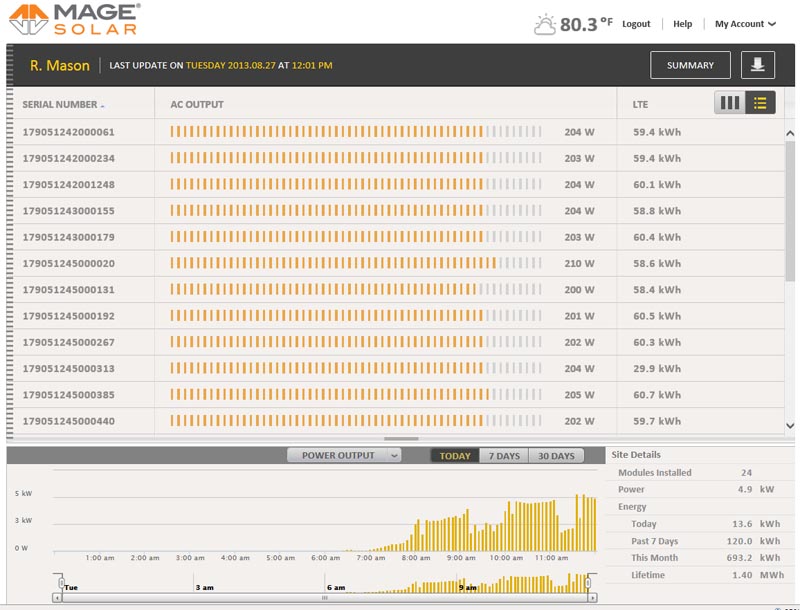
You can also display the panel information in list form with all the same options (except for the time lapse review) as in the layout form.
Downloading Data
In addition, You can download a .CSV (comma separated values - a common import and export file format) file for any date range in the last 30 days. The generated file is a .ZIP file (a compressed format) which expands to the .CSV file. This can be opened in an Excel spreadsheet and provides a line of data for each 5 minute period of the included time range.
This option is available in both the old and the new versions of the monitoring software with similar capabilities. Coming from the local data manager (the old version), the detail files actually include some additional data fields over the new portal version. The summary file actually includes less information. I didn't look too hard, but I never found a way to generate data for just a single panel. You can always do the detail version, and filter out data for just one module.
It is somewhat easier to create these files from the new version. If the download is done from the summary page, you get data for the total array every 5 minutes (288 entries/day) If it is done from the detail page, every panel is listed every 5 minutes for a total of 6912 entries/day. If you highlight a single panel first, only the data for that panel will be shown. Each line gives the date and time, the lifetime Wh generated, the currently generated watts, the AC voltage and the frequency. If the file is from the detail mode, the panel serial numbers are also included. If you download detail files for multiple days, a separate file will be generated for each day. For summary files, only a single file is generated regardless of the time span.
I have no current plans to utilize this data, but it is a goldmine for potential future projects where I might want to track this data for any reason, or even to make a quick calculation. I have already, as a test, manipulated the data in a file to repeat my earlier effort to determine output averages for the various geometries of panels. It was much easier this time!
I am very pleased with the new
software! Every complaint I had about the older version has been
answered by this version. I can now easily see the performance of
each panel in real time or in review. There are displays of the
energy output for everything from today to the lifetime of the
system. I do not see anything from the previous version that I
cannot do now, but a lot I can now do that was not possible
before. Good job SolarBridge and Mage!
R. S. Mason March,
2013